The conclusions from this study are summarized in the following.
1) The loudspeaker preferences of trained listeners were generally the same as those measured using a group of nominally untrained listeners composed of audio retailers, marketing and sales people, audio reviewers, and college students.
2) Different groups of listeners use different parts of the preference scale. Trained listeners use the lowest part of the preference scale, indicating they may be more critical and harder to please.
3) Significant differences in performance were meas- ured among the four different occupations. The average FL values of the trained listeners were 3 – 27 times higher than those measured by the other groups. The second most dis- criminating and reliable group of listeners were the audio retailers, followed by the audio reviewers who were about equal to the marketing and sales people. The students had the worst performance, most likely due to their lack of audio experience compared to the other groups.
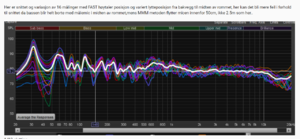
4) There were clear correlations between listeners’ loudspeaker preferences and a set of acoustic anechoic measurements. The most preferred loudspeakers had the smoothest, flattest, and most extended frequency responses maintained uniformly off axis.
5) The rank order of the loudspeaker preferences did not change between the four-way and the three-way tests. However, eliminating loudspeaker I in the three-way test reduced the differences in mean ratings between loud- speakers P, B, and M. The most likely cause is a scaling or context effect related to the number and relative sound quality of the loudspeakers compared in the test.
6) The individual loudspeaker F statistics were on aver- age seven times higher in the three-way test, indicating that rating these three loudspeakers may have been an eas- ier task for the listeners.

www.audiocheck.net


