Når aksepten for andres rabiate meninger og sinnsyke oppførsel skal være så skyhøy fordi man skal ha "frihet til å mene det man vil og tro på det man vil" at man faktisk har et scenario hvor man kan se for seg unge snøflak gå ut i avisene og si "Jeg ville stemt på Hitler - hva er problemet med det?" også er det plutselig alle andre som liksom skal skal ha et forklaringsproblem for hvorfor de skal være så intolerante og fordomsfulle ovenfor en som bare vil stemme på kandidaten han selv synes er best..... da føler jeg at det muligens er på tide å gå litt i seg selv.
Politikk, religion og samfunn President Donald J. Trump - Quo vadis? (Del 2)
- Trådstarter Høvdingen
- Startdato
Diskusjonstråd Se tråd i gallerivisning
-
Det sier vel det motsatte! Tross media og deres støtte til Harris så tenker folk selv fremfor å la seg hjernevaske
47 prosent av unge norske menn ville stemt på Trump
Nesten halvparten av unge norske menn sier de ville stemt på Donald Trump, hvis de fikk stemme ved det amerikanske valget. www.nrk.no
Dette er fryktelige tall. Det viser at forvirringen som skapes av "hver mann, sin virkelighet" har stor suksess. Leser man kommentarfeltene rundt omkring, så begynner man faen meg å lure på om en stor mengde av folket har fått i seg et eller annet som raner dem for grunnleggende sunn fornuft samt en hver tendens til intelligens. Kjenner at fremtiden bekymrer meg stadig mer.- Ble medlem
- 19.09.2014
- Innlegg
- 23.451
- Antall liker
- 16.341
Det kan også ses på hvor fjernt politikk etter hvert har fjernet seg for en bråte ting folk faktisk er opptatte av, og kanskje spesielt unge menn uten høyere utdannelse, AP har vel en oppslutning på rundt 5% blant unge menn for eksempel. Det har nærmst vært en pariakaste i mye av den offentlige debatten der de for det første ikke er kvinner som skal opp og frem og heller ikke har høyere utdannelse som lenge var eneste vei til frelsa selv om akkurat det nok er i ferd med å snu nå som man oppdager at det trengs fagarbeidere og kanskje er nok bachelorgrader i mediesosiologi og statsvintenskap i nasjonen.
47 prosent av unge norske menn ville stemt på Trump
Nesten halvparten av unge norske menn sier de ville stemt på Donald Trump, hvis de fikk stemme ved det amerikanske valget. www.nrk.no
Dette er fryktelige tall. Det viser at forvirringen som skapes av "hver mann, sin virkelighet" har stor suksess. Leser man kommentarfeltene rundt omkring, så begynner man faen meg å lure på om en stor mengde av folket har fått i seg et eller annet som raner dem for grunnleggende sunn fornuft samt en hver tendens til intelligens. Kjenner at fremtiden bekymrer meg stadig mer.
Og den aller største elefanten i rommet er selsvagt innvandring, hvori man nok finner en svært stor del av forklaringen på hvorfor politisk venstreside sliter over store deler av den vestlige verden siden fornektelsen på dette området har vært betydelig.I sannhet noen forunderlige tanker man da har... eller er det slik at man er nettopp ...hjernevasket?
"Vaska for vett" er et kjent nordnorsk uttrykk....
Hvorfor vokser fascismen?
Når folk er redde og engstelige for framtida, er det som bensin på fascismens bål. agendamagasin.no
Så det er negativt at unge men utgjør kun 5% for og stemme Ap ?Det kan også ses på hvor fjernt politikk etter hvert har fjernet seg for en bråte ting folk faktisk er opptatte av, og kanskje spesielt unge menn uten høyere utdannelse, AP har vel en oppslutning på rundt 5% blant unge menn for eksempel. Det har nærmst vært en pariakaste i mye av den offentlige debatten der de for det første ikke er kvinner som skal opp og frem og heller ikke har høyere utdannelse som lenge var eneste vei til frelsa selv om akkurat det nok er i ferd med å snu nå som man oppdager at det trengs fagarbeidere og kanskje er nok bachelorgrader i mediesosiologi og statsvintenskap i nasjonen.
Og den aller største elefanten i rommet er selsvagt innvandring, hvori man nok finner en svært stor del av forklaringen på hvorfor politisk venstreside sliter over store deler av den vestlige verden siden fornektelsen på dette området har vært betydelig.Skal ikke svare for @weld77, men ser ikke helt hvordan spørsmålet ovenfor rimer med innlegget..
Litt OT, men en viss sammenheng;
Forøvrig, samtidig som man "leter" etter sin frihet ser vi at bygdene avfolkes og folk flytter inn til byene og lar seg "uniformere" i byenes høyblokker, trangboddhet, økende kriminalitet, betong, bilkøer, reguleringer i hytt og pine, +++. Så kan kan man undres om trumpismen er svaret på det? Vanskelig å vite hva unge menn drømmer om, men det er helt åpenbart at på toppen av enhver "næringskjede" er det bare noen få på toppen som høster fruktene. Jeg er ganske sikker at på de toppene vil man ikke finne alle de tilsynelatende unge som ville stemt trump .. (det er bare en trump, det er bare en musk, en Zuckerberg, en bill gates, en..., en tate,.. en..)
Og det er bare å se østover for de som melder seg inn i det grande rotteracet..
Jeg leser for tiden Nexus med Yuval Noah Harari. Igjen en bra bok fra Harari som penser innom tema "hver mann sin virkelighet". Boka tar for seg historien om informasjonsteknologi helt fra steinalderen.
47 prosent av unge norske menn ville stemt på Trump
Nesten halvparten av unge norske menn sier de ville stemt på Donald Trump, hvis de fikk stemme ved det amerikanske valget. www.nrk.no
Dette er fryktelige tall. Det viser at forvirringen som skapes av "hver mann, sin virkelighet" har stor suksess. Leser man kommentarfeltene rundt omkring, så begynner man faen meg å lure på om en stor mengde av folket har fått i seg et eller annet som raner dem for grunnleggende sunn fornuft samt en hver tendens til intelligens. Kjenner at fremtiden bekymrer meg stadig mer.
"Sunn fornuft" er alt for komplisert for folk flest. De vil heller ha en enkel historie.
Internett og moderne informasjonsteknologi gjør det motsatte av det som man skulle tro dessverre.Så det er de enkle historiene som vinner frem på nettet?
Med synkende leseferdigheter og Youtube Shorts som nyhetskilde et det ikke sjokkerende, men litt underlig at omgivelsene, familie, vennet og skole, tillater at ungdommene driver slik «utmelding».Det er alt for mange som har sett alt for mye på Jordan Peterson på Youtube og blitt "frelst".
Hadde de også i sett litt på https://www.youtube.com/@Pangburn hadde de sett at det meste han kommer med ikke henger på greip
Matt Dillahunty, Sam Harris og Richard Dawkins avslører han effektivt og elegant.
Sist redigert:HHardingfele
Gjest
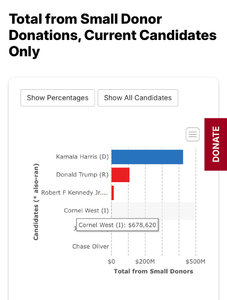
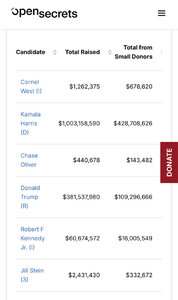
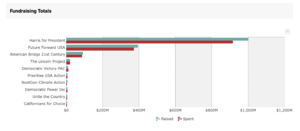
Her finner du info om hvem som gir/støtter. Harris har stor andel fra «small donors», under USD 1000. En del PACs.sensur fra toppen og ned er ikke bra imo.
Hvis de som leder et land kontrollerer hvilken informasjon «de dumme»(oss) får tilgang til, er løpet kjørt.
Særlig hvis vi tror på alt som blir sagt/skrevet.
@Hardingfele Hvor tror du pengene til Harris kommer fra, og ønsker store donorer å få noe tilbake?


Den som nok er mest i lommene på sterke interesser er Trump, som har mye penger fra store enkeltdonasjoner.
Du finner mye info på sidene.HHardingfele
Gjest
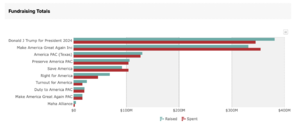
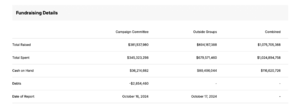
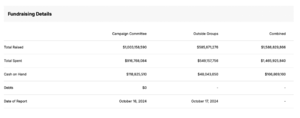
Disse oversiktene gir også et bilde.
Trump. Som du ser noen store PACs bak Trump, i tillegg til midlene som kommer inn til ham (øverste), der størstedelen er fra meget store givere.


Kamala Harris. Færre "outside organizations", som PACs, av noen størrelse. Mesteparten av pengene har gått rett til kampanjen, der litt under 50% er fra små givere.

 Det å servere fakta på den måten er ren hersketeknikk spør du meg.
 Flere unge menn blir intervjuet om sin Trump-støtte. Ærlig talt er det vanskelig å lese gjennom denne saken, så ubehagelig flaut er det.
Mange unge, norske menn ville stemt på Trump. Herman Winther er én av dem.
Filosofistudenten mener rommet for hva det er lov å si er blitt for smalt. Subjekt-redaktør Danby Choi kaller Donald Trump for kul.www.aftenposten.no
Jeg tror problemet er at mange av disse gutta ikke fatter hvor privilegerte de er. Tror de at alt her i verden skal serveres på et sølvfat?
Dette er altså studenter, som etter en økt på gymmen kommer hjem til en saftig biff for så å råne med tøffe biler.Flere unge menn blir intervjuet om sin Trump-støtte. Ærlig talt er det vanskelig å lese gjennom denne saken, så ubehagelig flaut er det.
Mange unge, norske menn ville stemt på Trump. Herman Winther er én av dem.
Filosofistudenten mener rommet for hva det er lov å si er blitt for smalt. Subjekt-redaktør Danby Choi kaller Donald Trump for kul.www.aftenposten.no
Jeg tror problemet er at mange av disse gutta ikke fatter hvor privilegerte de er. Tror de at alt her i verden skal serveres på et sølvfat?
Ikke rart de ikke får pult, og i enda mindre grad finner seg en dame som itillegg til å føde unga deres skal stå klar med biffen før de skal ut og råne med kompisene.UUtgattmedlem 762
Gjest
x.com
 x.com
B
x.com
BbrunBar
Gjest
Ingen snakker sant om Trump
Nesten halvparten av unge menn i Norge sier de ville ha stemt på Donald Trump. Jeg mener noe av grunnen er at voksengenerasjonen har holdt dagens unge for narr. www.vg.no
Han drar det vel langt når han forsvarer trumps kriminelle historie ved at alle amerikanene stammer fra kriminelle fra Great Britain. LOL...
Så går det videre til antivaks og Kennedy.. Videre snakker han om at trump er rik (og dermed smart?) og at han derfor ikke er i lomma på store firma. Det er bare helt tullete..
Iowa kan nå være Harris sin delstat, et lite sjokk nå i innspurten.
Denne valgnatten kan bli ekstremt spennende. Det blir sånn type historisk hendelse…»husker du hva du gjorde valgnatten 6. november 2024?»
Ny vippestat i natt
LAS VEGAS (VG) En fersk meningsmåling kan utvide vippestatkartet med Iowa helt i innspurten av valgkampen. Det er gode nyheter for Kamala Harris. www.vg.no
Sist redigert:H
www.vg.no
Sist redigert:HHardingfele
Gjest
She is stupid. Low IQ. Doesn't know anything. Doesn't know what to say.
Maybe not.
Harris var på Saturday Night Live i går.
- Ble medlem
- 04.04.2011
- Innlegg
- 2.042
- Antall liker
- 1.006

Dakota Adams rømte fra farens konspirasjonsteorier
Stewart Rhodes var en av hovedmennene bak stormingen av Kongressen i USA. Nå frykter sønnen hans at han kan bli benådet. www.nrk.no
Jeffrey Epstein, Trumps gamle bestevenn.

Listen To The Jeffrey Epstein Tapes: ‘I Was Donald Trump’s Closest Friend’
Explosive tapes recorded by author Michael Wolff show Epstein claiming Trump liked to “f---” his friends’ wives and first slept with Melania on the “Lolita Express.”www.thedailybeast.com
HHardingfele
Gjest
Interessant om hvordan meningsmålere må justere data de samler inn, på grunn av usikkerhetsmomenter og lav svarprosent. Fra NYT/Siena meningsmålingen.
Egentlig er sluttmeldingen helt i det blå, på grunn av alle justeringene som gjennomføres. Tirsdag natt får vi facit.
Fra bunnen av siden:
Weighting (registered voters)
The survey was weighted by The Times using the survey package in R in multiple steps.
First, the sample was adjusted for unequal probability of selection by stratum.
Second, the sample was split by party (party registration if available in the state, else classification based on participation in partisan primaries if available in the state, else classification based on a model of vote choice in prior Times/Siena polls) and each subgroup was weighted to match voter file-based parameters for the characteristics of registered voters for that group.
The following targets were used:
• Race or ethnicity (L2 model)
• Age (self-reported age, or voter-file age if the respondent refused) by gender (L2 data)
• Education (four categories of self-reported education level, weighted to match NYT-based targets derived from Times/Siena polls, census data and the L2 voter file)
• White/nonwhite race by college or noncollege educational attainment (L2 model of race weighted to match NYT-based targets for self-reported education)
• Marital status (L2 model)
• Homeownership (L2 model)
• Turnout history (NYT classifications based on L2 data)
• Method of voting in the 2020 elections (NYT classifications based on L2 data)
• Metropolitan status (2013 NCHS Urban-Rural Classification Scheme for Counties)
• Census tract educational attainment
• National region
• History of participation in party primaries (NYT classifications based on L2 data), if part of the Democratic or Republican group
Third, the sums of the weights were balanced so that each group represented the proper proportion of the poll.
Finally, the two split groups for the sample of respondents who completed all questions in the survey were weighted identically as well as to the result for the general-election horse-race question (including voters leaning a certain way) on the full sample, and the sums of the weights of the split groups were balanced so that each group represented the proper proportion of the sample of respondents who completed the questionnaire.
Weighting (likely electorate)
The survey was weighted by The Times using the R survey package in multiple steps.
First, the samples were adjusted for unequal probability of selection by stratum.
Second, the first-stage weight was adjusted to account for the probability that a registrant would vote in the 2024 election, based on a model of turnout in the 2020 election.
Third, the sample was weighted to match targets for the composition of the likely electorate, using the process and weighting categories described above. The targets for the composition of the likely electorate were derived by aggregating the individual-level turnout estimates described in the previous step for registrants on the L2 voter file.
Fourth, the initial likely electorate weight was adjusted to incorporate self-reported intention to vote. Four-fifths of the final probability that a registrant would vote in the 2024 election was based on the registrant’s ex ante modeled turnout score, and one-fifth was based on self-reported intentions, based on prior Times/Siena polls, including a penalty to account for the tendency of survey respondents to turn out at higher rates than nonrespondents. The final likely electorate weight was equal to the modeled electorate rake weight, multiplied by the final turnout probability and divided by the ex ante modeled turnout probability.
Finally, the sample of respondents who completed all questions in the survey was weighted identically as well as to the result for the general election horse-race question (including leaners) on the full sample.
The margin of error accounts for the survey’s design effect, a measure of the loss of statistical power due to survey design and weighting.
The design effect is 1.32 for the likely electorate and 1.23 for registered voters. The margin of error for the sample of respondents who completed the entire survey is plus or minus 2.5 percentage points for the likely electorate, including a design effect of 1.41, and plus or minus 2.5 percentage points for registered voters, including a design effect of 1.35.
Historically, The Times/Siena Poll’s error at the 95th percentile has been plus or minus 5.1 percentage points in surveys taken over the final three weeks before an election. Real-world error includes sources of error beyond sampling error, such as nonresponse bias, coverage error, late shifts among undecided voters and error in estimating the composition of the electorate.HHardingfele
Gjest
Republican Jesus.
Si meg en ting, kom ikke Jesus ridende på et esel?Republican Jesus.
Det siste er viktigst. Meningsmålerne forsøker å vekte seg frem til hvordan velgersammensetningen vil bli denne gangen, etter å ha brent seg i 2016 på å ha oversett potensielle trump-velgere som vanligvis ikke avgir stemme. Resultatet denne gangen kan bli en grundig overvekting av maga-demografien, som dessuten nærmest blir intervjuet i filler i forsøkene på å «forstå» disse besynderlige vesenene.Interessant om hvordan meningsmålere må justere data de samler inn, på grunn av usikkerhetsmomenter og lav svarprosent. Fra NYT/Siena meningsmålingen.
Egentlig er sluttmeldingen helt i det blå, på grunn av alle justeringene som gjennomføres. Tirsdag natt får vi facit.
[…]
Historically, The Times/Siena Poll’s error at the 95th percentile has been plus or minus 5.1 percentage points in surveys taken over the final three weeks before an election. Real-world error includes sources of error beyond sampling error, such as nonresponse bias, coverage error, late shifts among undecided voters and error in estimating the composition of the electorate.
Det man derimot kan være sikker på er at elektoratet i 2024 vil være nokså annerledes enn i 2016. Sistegangsvelgerne da deltar ikke nå, førstegangsvelgerne nå deltok ikke da. Det er ganske mange millioner. Det er ganske mange unge kvinner som vil stemme som om livet deres avhenger av utfallet, for det gjør det jo. Deres mødre og bestemødre er også forbannet. Om meningsmålerne plukker opp dette er uvisst, spesielt når faktorer som «deltok i primærvalgene» brukes som kriterie. Det gjorde disse unge kvinnene garantert ikke, siden Biden og trump de facto var kandidater allerede. Vi får snart se.

These red-state polls look terrible for Trump
Saturday’s Iowa poll from renown pollster J. Ann Selzer showed Vice President Kamala Harris ahead in Iowa 47-44, but it isn’t the only poll suggesting that something big is happening in our country.www.dailykos.com
Sist redigert:Donald oppsummert

New York Times Editorial Board Rips Apart Donald Trump in Single Paragraph
The paper’s latest indictment of Trump was all the more brutal for its brevity.www.thedailybeast.com
Fortjener et sitat også:Donald oppsummert

New York Times Editorial Board Rips Apart Donald Trump in Single Paragraph
The paper’s latest indictment of Trump was all the more brutal for its brevity.www.thedailybeast.com
Here it is in full, with its original links to other Times coverage of Trump preserved:
“You already know Donald Trump. He is unfit to lead. Watch him. Listen to those who know him best. He tried to subvert an election and remains a threat to democracy. He helped overturn Roe, with terrible consequences. Mr. Trump’s corruption and lawlessness go beyond elections: It’s his whole ethos. He lies without limit. If he’s re-elected, the G.O.P. won’t restrain him. Mr. Trump will use the government to go after opponents. He will pursue a cruel policy of mass deportations. He will wreak havoc on the poor, the middle class and employers. Another Trump term will damage the climate, shatter alliances and strengthen autocrats. Americans should demand better. Vote.”HHardingfele
Gjest
Det utrolige, og ubegripelige, og uforståelige, er at en slik mann får støtte fra titalls millioner, og at ledelsen i Det republikanske partiet har lagt seg flate for ham, i feig underkastelse for dette foraktelige vesenet.Fortjener et sitat også:
Here it is in full, with its original links to other Times coverage of Trump preserved:
“You already know Donald Trump. He is unfit to lead. Watch him. Listen to those who know him best. He tried to subvert an election and remains a threat to democracy. He helped overturn Roe, with terrible consequences. Mr. Trump’s corruption and lawlessness go beyond elections: It’s his whole ethos. He lies without limit. If he’s re-elected, the G.O.P. won’t restrain him. Mr. Trump will use the government to go after opponents. He will pursue a cruel policy of mass deportations. He will wreak havoc on the poor, the middle class and employers. Another Trump term will damage the climate, shatter alliances and strengthen autocrats. Americans should demand better. Vote.”
Dersom Biden ikke hadde trådt til side ville Trump vunnet valget. Nå er det en mulighet for at han forvises fra offentlig oppmerksomhet, som det kreket han er.
Og @Roald - forsøk å finne bedre idoler.Sist redigert av en moderator:Om du tror Trump er et idol for meg tar du nok grundig feil, jeg er helt uten idoler på alle fronter. Det er jo en hel del ting som er trist med valget men for en som er opptatt av at folk skal kunne gjøre kvalifiserte valg, så er jo mediene en katastrofe og det gjelder ikke bare valget i USA.
Og det er helt greit om andre faller ned på andre standpunkter bare man kunne fått objektiv og korrekt informasjon, men man kan i dag ikke stole på media og jo mer kampanjejournalistikk man får dess lavere tillit og villere konspirasjonsteorier vil følge.
Det nærmer seg valg så kan jo legge inn alternativ video som omhandler reinkarnasjonen av djevelen slik man leser her inne.
-
Laster inn…
Diskusjonstråd Se tråd i gallerivisning
-
-
Laster inn…


